
🎥 Watch the Safety module overview
The Safety module lets you log incidents, attach reports and photos, and see trends over time. Open it from the shield icon in the left menu.
Set up locations (optional)
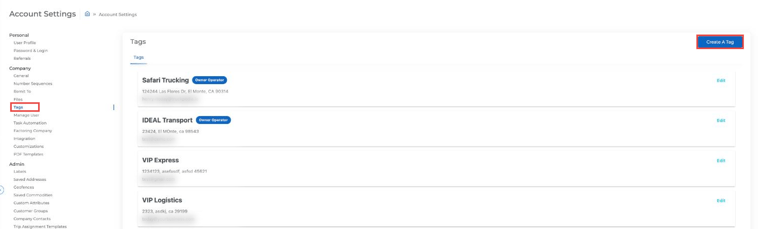
To track incidents by terminal, yard or site, create a tag for each one in Settings → Company → Tags. You can then pick the tag on each incident and filter your statistics by it.
View your incidents
The Safety module has three views at the top: Spreadsheet, List and Statistics. In the Spreadsheet view you can filter, sort and Export your incidents to Excel.

Add an incident
- Click + ADD INCIDENT.
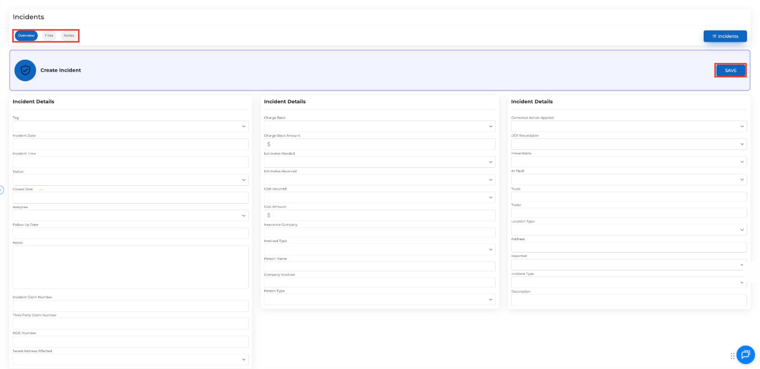
- Fill in the details, such as:
- Tag (location), date, time, status and assignee for follow-up
- Charge back, estimates, cost and insurance company
- Who was involved (person, company and type)
- Corrective action, DOT recordable, preventable and at fault
- Truck, trailer, location type, address, incident type and description
- Claim numbers and notes
- Click SAVE.
Add files and notes
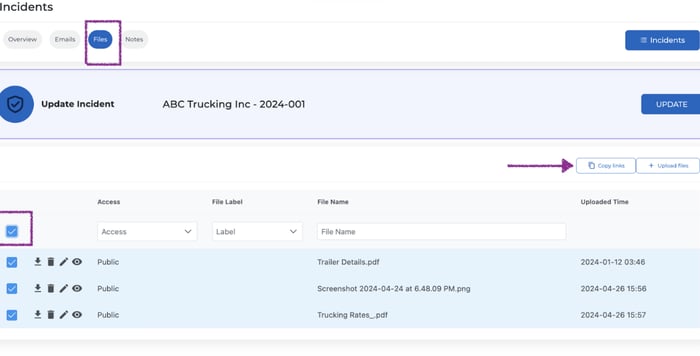
Open an incident and use the Files tab to upload police reports, photos, videos or internal reviews. You can copy a shareable link for outside parties like insurance companies or lawyers. Use the Notes tab to keep updates on how it's being resolved.
See incident statistics
Click Statistics and choose a date range at the top right. You can switch between:
- Tables and Graphs: incidents by tag (location), type, location type, preventable and at fault, month by month
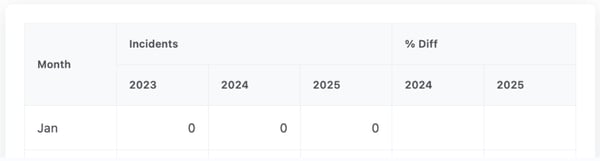
- Comparison Tables By Year and Comparison Graphs By Year: year-over-year trends so you can spot improvements or problem areas

Questions? Email help@truckpedia.io.