
🎥 Video Guide: Truckpedia Dashboard Overview
Navigating the Dashboard
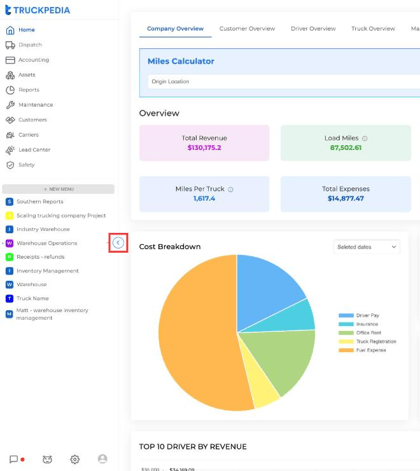
When you log in, the Home dashboard shows your company’s key numbers.
- Click the arrow on the left side of the screen to expand or collapse the menu and move between modules like Dispatch, Accounting, Assets, Reports, Maintenance, Customers, Carriers, Lead Center and Safety.
Home Dashboard Tabs
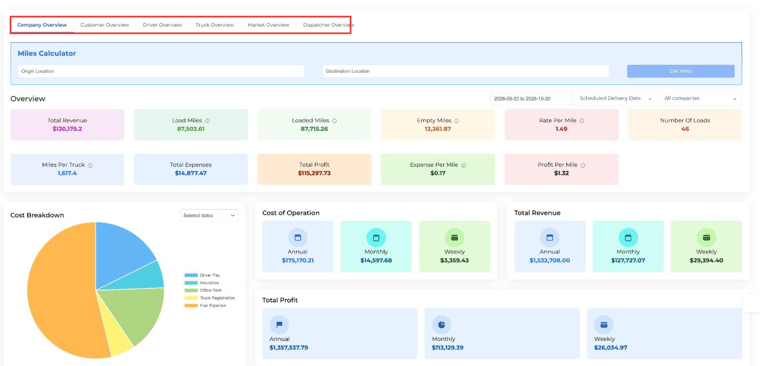
The dashboard has six tabs across the top:
- Company Overview → track your financial performance
- Customer Overview → see revenue by customer
- Driver Overview → compare driver productivity
- Truck Overview → monitor fleet efficiency
- Market Overview → see your strongest markets and lanes
- Dispatcher Overview → measure dispatcher output
At the top of every tab you’ll also find the Miles Calculator. Enter an origin and destination and click Get Miles. Use the date range, date type (for example Scheduled Delivery Date) and company filters on the right to change the period you’re looking at.
Company Overview – Financial Snapshot
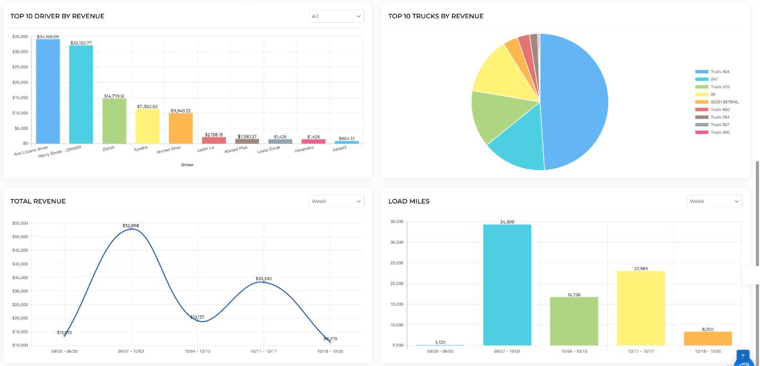
Shows a high-level summary of your company's financial and operational performance.
Key Metrics:
- Total Revenue and Number of Loads
- Load Miles, Loaded Miles and Empty Miles
- Rate Per Mile and Miles Per Truck
- Total Expenses, Total Profit, Expense Per Mile and Profit Per Mile
- Cost Breakdown, Cost of Operation, Total Revenue and Total Profit (annual, monthly and weekly)
Charts:
- Top 10 Drivers by Revenue
- Top 10 Trucks by Revenue
- Total Revenue and Load Miles over time (by week or month)
Customer Overview – Revenue by Customer
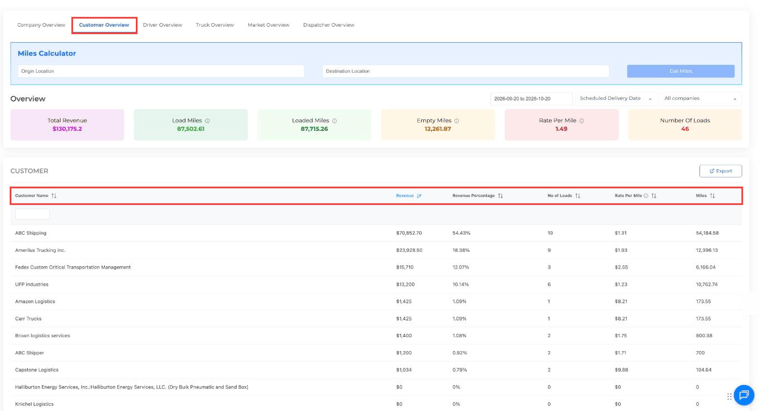
Breaks down performance by customer so you can spot your top accounts.
Columns:
- Revenue and Revenue Percentage
- Number of Loads
- Rate Per Mile
- Miles
Click Export to download the list.
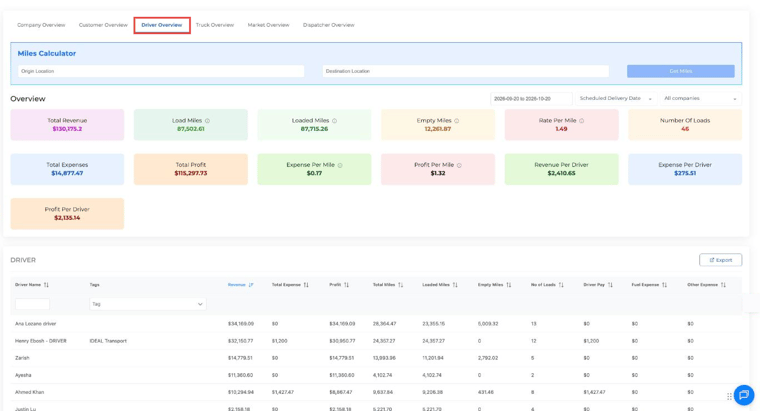
Driver Overview – Performance Tracking
Helps you evaluate driver performance and profitability.
Key Metrics:
- Revenue Per Driver, Expense Per Driver and Profit Per Driver
- Per driver: Revenue, Total Expense, Profit, Total Miles, Loaded Miles, Empty Miles and Number of Loads
- Driver Pay, Fuel Expense and Other Expense
You can filter the list by driver name or tag.
Truck Overview – Fleet Utilization
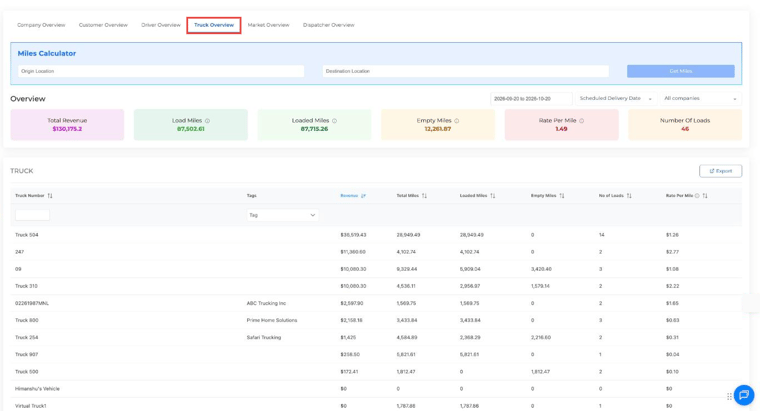
Shows how each truck is performing.
Columns:
- Revenue
- Total Miles, Loaded Miles and Empty Miles
- Number of Loads
- Rate Per Mile
Market Overview – Markets & Lanes
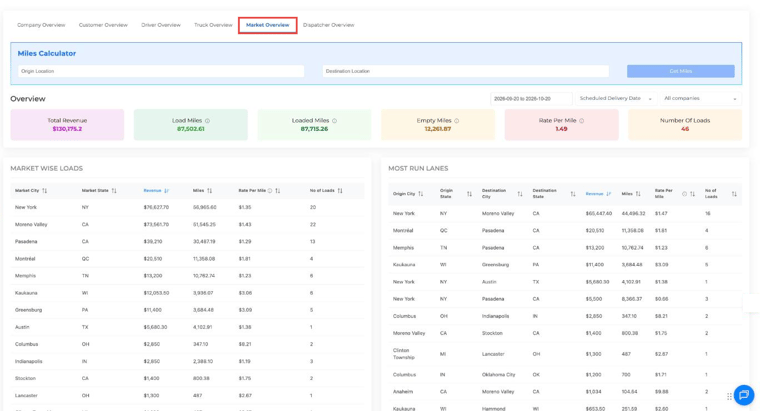
Tracks where your freight moves to support better pricing and routing decisions.
- Market Wise Loads: revenue, miles, rate per mile and number of loads by city and state
- Most Run Lanes: your top origin and destination pairs with revenue, miles, rate per mile and number of loads
Dispatcher Overview – Team Performance
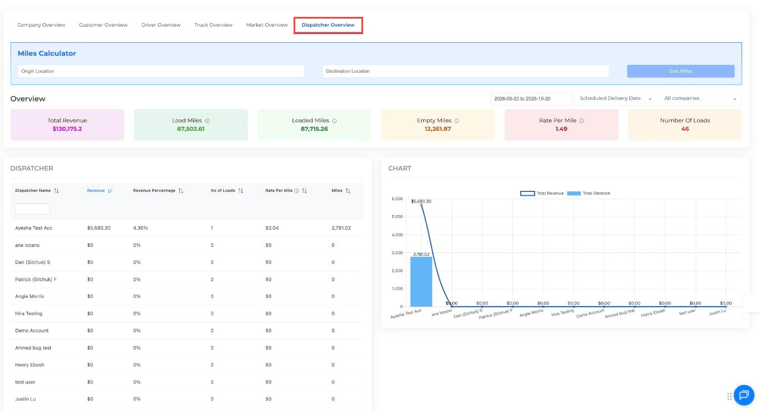
Tracks how each dispatcher contributes to operations.
- Revenue and Revenue Percentage
- Number of Loads
- Rate Per Mile
- Miles
A chart on the right compares total revenue and total distance by dispatcher.
The Truckpedia dashboard helps you monitor operations in real time, spot inefficiencies and make data-backed decisions.
If you need further assistance, please contact help@truckpedia.io.